CASE STUDY
TrustClarity: OpenTelemetry and SigNoz Observability on AWS ECS
IMPACT
5 production services instrumented with OpenTelemetry; 22 Terraform-managed alerts to Microsoft Teams; ClickHouse disk-full silent data loss diagnosed and hardened
Deployed OpenTelemetry and SigNoz on AWS ECS for a B2B surplus equipment platform — instrumenting 5 production services with 22 Terraform-managed alerts, then hardening ClickHouse after a silent data-loss incident.
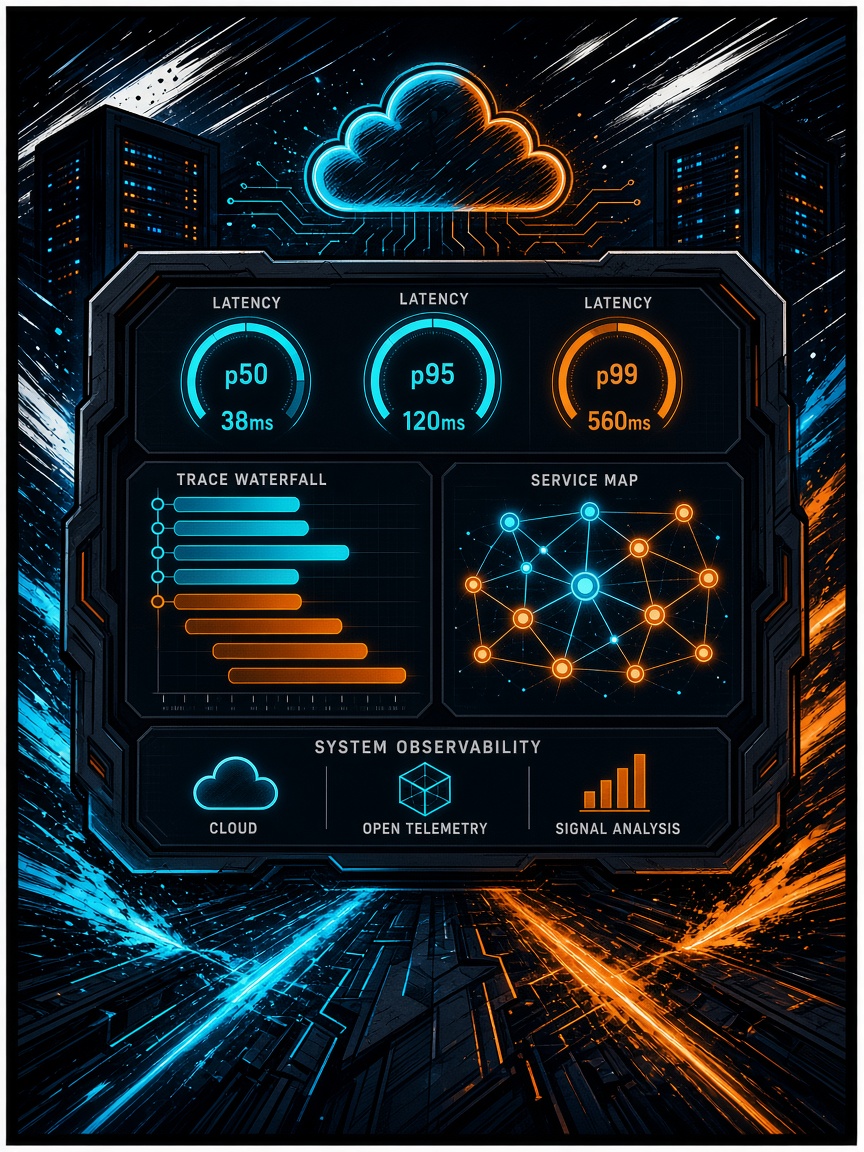
IMPACT AT A GLANCE
5
Services
22
Alerts
OTel
Instrumentation
TIMELINE
Mar 2026 — SigNoz stack, Phase 1 instrumentation, knowledge-graph two-tier alerts, ClickHouse hardening
ROLE
Solo Full-Stack Consultant — observability architecture, OpenTelemetry instrumentation, Terraform alerting, and AWS ECS operations
TEAM
Solo engagement
THE CHALLENGE
TrustClarity ran five active production services with zero observability. Latency regressions, dependency failures, and telemetry pipeline outages could not be detected until users reported them. The platform needed a self-hosted OpenTelemetry + SigNoz stack on AWS ECS, consistent instrumentation across Node, Next.js, Express/GraphQL, FastAPI, and a legacy React 16 app, and Terraform-managed alerts that would reach the team in Microsoft Teams.
THE RESULTS
- Deployed SigNoz on AWS ECS (ClickHouse, ZooKeeper, OTel Collector, SigNoz UI) with VPC networking, EFS persistence, ALB, and Terraform-managed infrastructure
- Instrumented 5 production services with OpenTelemetry — server traces, browser Web Vitals, log correlation, and custom knowledge-graph metrics
- 22 Terraform-managed alerting rules across services plus ClickHouse disk usage, all routing to Microsoft Teams
- Two-tier alert model for the knowledge-graph / GraphRAG service — trace-based service-health alerts and custom-metric alerts for graph queries, LLM calls, and embeddings
- Diagnosed silent OTel data loss when ClickHouse's internal query log filled a 20 GiB EBS volume; live-expanded to 50 GiB, added TTL retention, and shipped an 80% disk alert
THE SOLUTION
Designed and operated a self-hosted SigNoz observability stack on AWS ECS, then instrumented TrustClarity's five production services with OpenTelemetry. Alerts are defined in Terraform and notify Microsoft Teams. After a silent ClickHouse disk-full incident dropped all telemetry writes, the stack was hardened with TTL retention and a hostmetrics-based disk-usage alert.
TECHNOLOGIES USED
- OpenTelemetry
- SigNoz
- AWS ECS
- Terraform
- ClickHouse
- Node.js
- Next.js
- FastAPI
Project Details
What problem did zero observability create across five production services?
TrustClarity had five active production services and no shared view of latency, errors, or dependency health. Failures in the corporate site, buyer app, admin API, knowledge graph, and legacy frontend were invisible until someone noticed broken behavior. Without traces and alerts, there was no way to tell a slow graph query from a client-side regression, or to know whether the telemetry pipeline itself had stopped accepting data.
How was OpenTelemetry and SigNoz stood up on AWS ECS?
I designed and deployed SigNoz on Amazon ECS: ClickHouse for signal storage, ZooKeeper, the OpenTelemetry Collector, and the SigNoz UI. Persistence used EBS for ClickHouse and EFS for SigNoz state, with an ALB in front of the UI and OTLP ingest. Infrastructure and alerting lived as code, with Microsoft Teams as the notification channel. The SigNoz UI stays private; browser telemetry from public visitors is proxied through the corporate site's Express server rather than exposing a public observability URL.
All five services were instrumented to report to SigNoz:
- Corporate site (Node.js/Express): server traces plus browser Web Vitals via a proxy endpoint
- Buyer app (Next.js): browser-side OpenTelemetry SDK
- Admin API (Express + GraphQL): server traces with structured-log correlation
- Knowledge graph (FastAPI): manual spans and custom metrics for graph queries, LLM calls, and embeddings
- Legacy frontend (React 16): pre-bundle pattern to work around an older Webpack toolchain
Per-service Terraform alerts cover P95 latency, error rates, and absence detection where appropriate. The knowledge-graph service uses a two-tier model: Tier 1 for service health (absent traces, error rate, route-specific latency) and Tier 2 for dependency lag on graph, LLM, and embedding backends — so slow dependencies can fire even when the request eventually succeeds.
What did the ClickHouse incident teach, and what shipped?
In March 2026, traces and metrics stopped appearing in SigNoz while the collector still returned HTTP 200. ClickHouse was rejecting writes because its 20 GiB EBS volume was full — almost entirely from ClickHouse's internal query-profiling log with no TTL, while actual signal tables held only tens of megabytes.
I live-expanded the volume to 50 GiB with no container restart, truncated bloated system tables, configured TTL retention on signal and system tables, and added a Terraform disk-usage alert that fires to Microsoft Teams at 80% capacity. Combined with instrumentation across five services and 22 Terraform-managed alerts, that closed the blind spot where a healthy collector response masked a broken store.
MORE WORK
OTHER CASE STUDIES

TrustClarity: Buyer Portal Rebuild — Search-First TC 2.0 Platform
IMPACT:
400+ Storybook stories across 130+ components (from 11), WCAG 2.1 AA remediation, RFQ flow with server-side credential fix, and 1,533 lines of storefront code removed for a search-first pivot
React/Next.js rebuild of TrustClarity's core buyer workflows — Figma-to-production, WCAG 2.1 AA, Storybook/Chromatic visual gates, and a search-first architecture that replaced the per-org storefront layer.
TrustClarity: Orchestrating Google Jules Multi-Agent Delivery on the Buyer Platform
IMPACT:
Four signed merges into develop covering AGENTS.md plus three UAT fixes; one additional thumbnail/search fix with a TypeScript no-suppression governance lesson; durable signed-commit / pull-and-re-PR playbook confirmed across later Jules rounds
Production orchestration of Google Jules on the TrustClarity buyer platform — first and second UAT rounds, signed-commit re-PR playbook, prompt discipline, and AGENTS.md governance that kept parallel cloud sessions safe to merge.
TrustClarity: Supply-Chain Security Analysis and CI/CD Hardening
IMPACT:
14 of 20 repositories remediated before TrustClarity production; 3 attack vectors eradicated; SHA-pinned reusable security-scan workflow rolled out to 20 repos; later SHA-pin and merge-base invisibility controls shipped
Org-wide supply-chain security analysis for TrustClarity — malicious code found in 14 of 20 repositories across three attack vectors, remediated in repos before it reached TrustClarity's own production environment, followed by a SHA-pinned reusable CI/CD security pipeline and later hardening controls.